A tiring week is behind me. Following on from the previous blog post, Adelaide (and the rest of Australia) was plunged into an intense heatwave. Whilst Adelaide only copped a string of three days above 40C, other parts of the interior and Eastern centres were hit with ridiculously scary highs of 46-47C, smashing all kinds of Summer climate records. The planet’s getting crankier with us. Meanwhile during the same week – as cities and regional centres sweltered and bushfires sprung up all over the place – the federal government mocked renewable energy again and taunted the Opposition in the House Of Representative with an actual lump of coal, espousing the virtues of ‘clean coal’. Wind turbines and solar farms be damned, this is apparently part of the ‘Australian energy mix’ for the next fifty years or so.

It seemed remarkable that our own government could beat out Trump this week in terms of demoralising me and our tenuous existence, but this was like a kick to the brain of any sensible, educated person. Oof.
Oh well, we’ll face the music and dance.
Or in my particular case, I’ll sit down at my desk with various notes, a Max/MSP patch, vocoder, effects and resume working on a project I’ve been nurturing since 2014 – Goyder’s Line. Heatwaves, drought and more recently climate change have prefigured strongly in the inspiration and development of this work since 2014. So in that sense, my introduction was less of a political rant and more of a providing a prelude to this very long post.
Goyder’s Line has been mentioned at regular intervals on this blog as it’s gone through various stages of development. The work is unique in the sense that this is the first work that I’ve regularily returned to over the years, making numerous refinements to its technical process whilst further investigating the broader contextual aspects of the work.
What is ‘Goyder’s Line’?
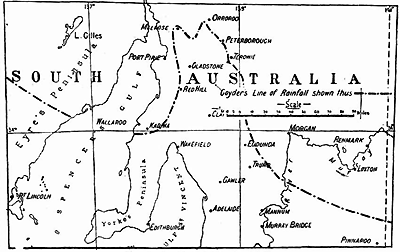
‘Goyder’s Line’ is an isopleth[1] starting near the Ceduna region then extending across South Australia and terminating at the SA-Victorian border north of Pinnaroo. This boundary was developed during 1865 by Surveyor-General of the South Australian colony, George Goyder. Goyder had been asked to map the boundary between areas which received good rainfall and those that experienced drought. This would allow settlers to determine where the best climate and growing conditions were to the north of Adelaide and beyond. Goyder traversed over 3000km on horseback surveying the region and submitted his detailed report consisting of a line of demarcation. The areas above the line were deemed liable to drought whilst areas to the south being predominantly arable.
[1] Used specifically in meteorological and cartographic fields, an isopleth is a noun used to define a line on a map connecting points.
Background of the Goyder’s Line work (2013-14):
My first encounter with the concept of Goyder’s Line occured early in 2013 upon a visit to Peterborough – located approximately 300km north of Adelaide. If you travel to this region, by the time you reach Peterborough the climate and terrain is arid and crop based argiculture is virtually non-existent. The region of Peterborough situated closely to Goyder’s Line and heading further north reveals an increasingly arid, dry and inhospitable environment. One day during my stay in Peterborough, I made a trip with a couple of family members to the abandoned town of Dawson.
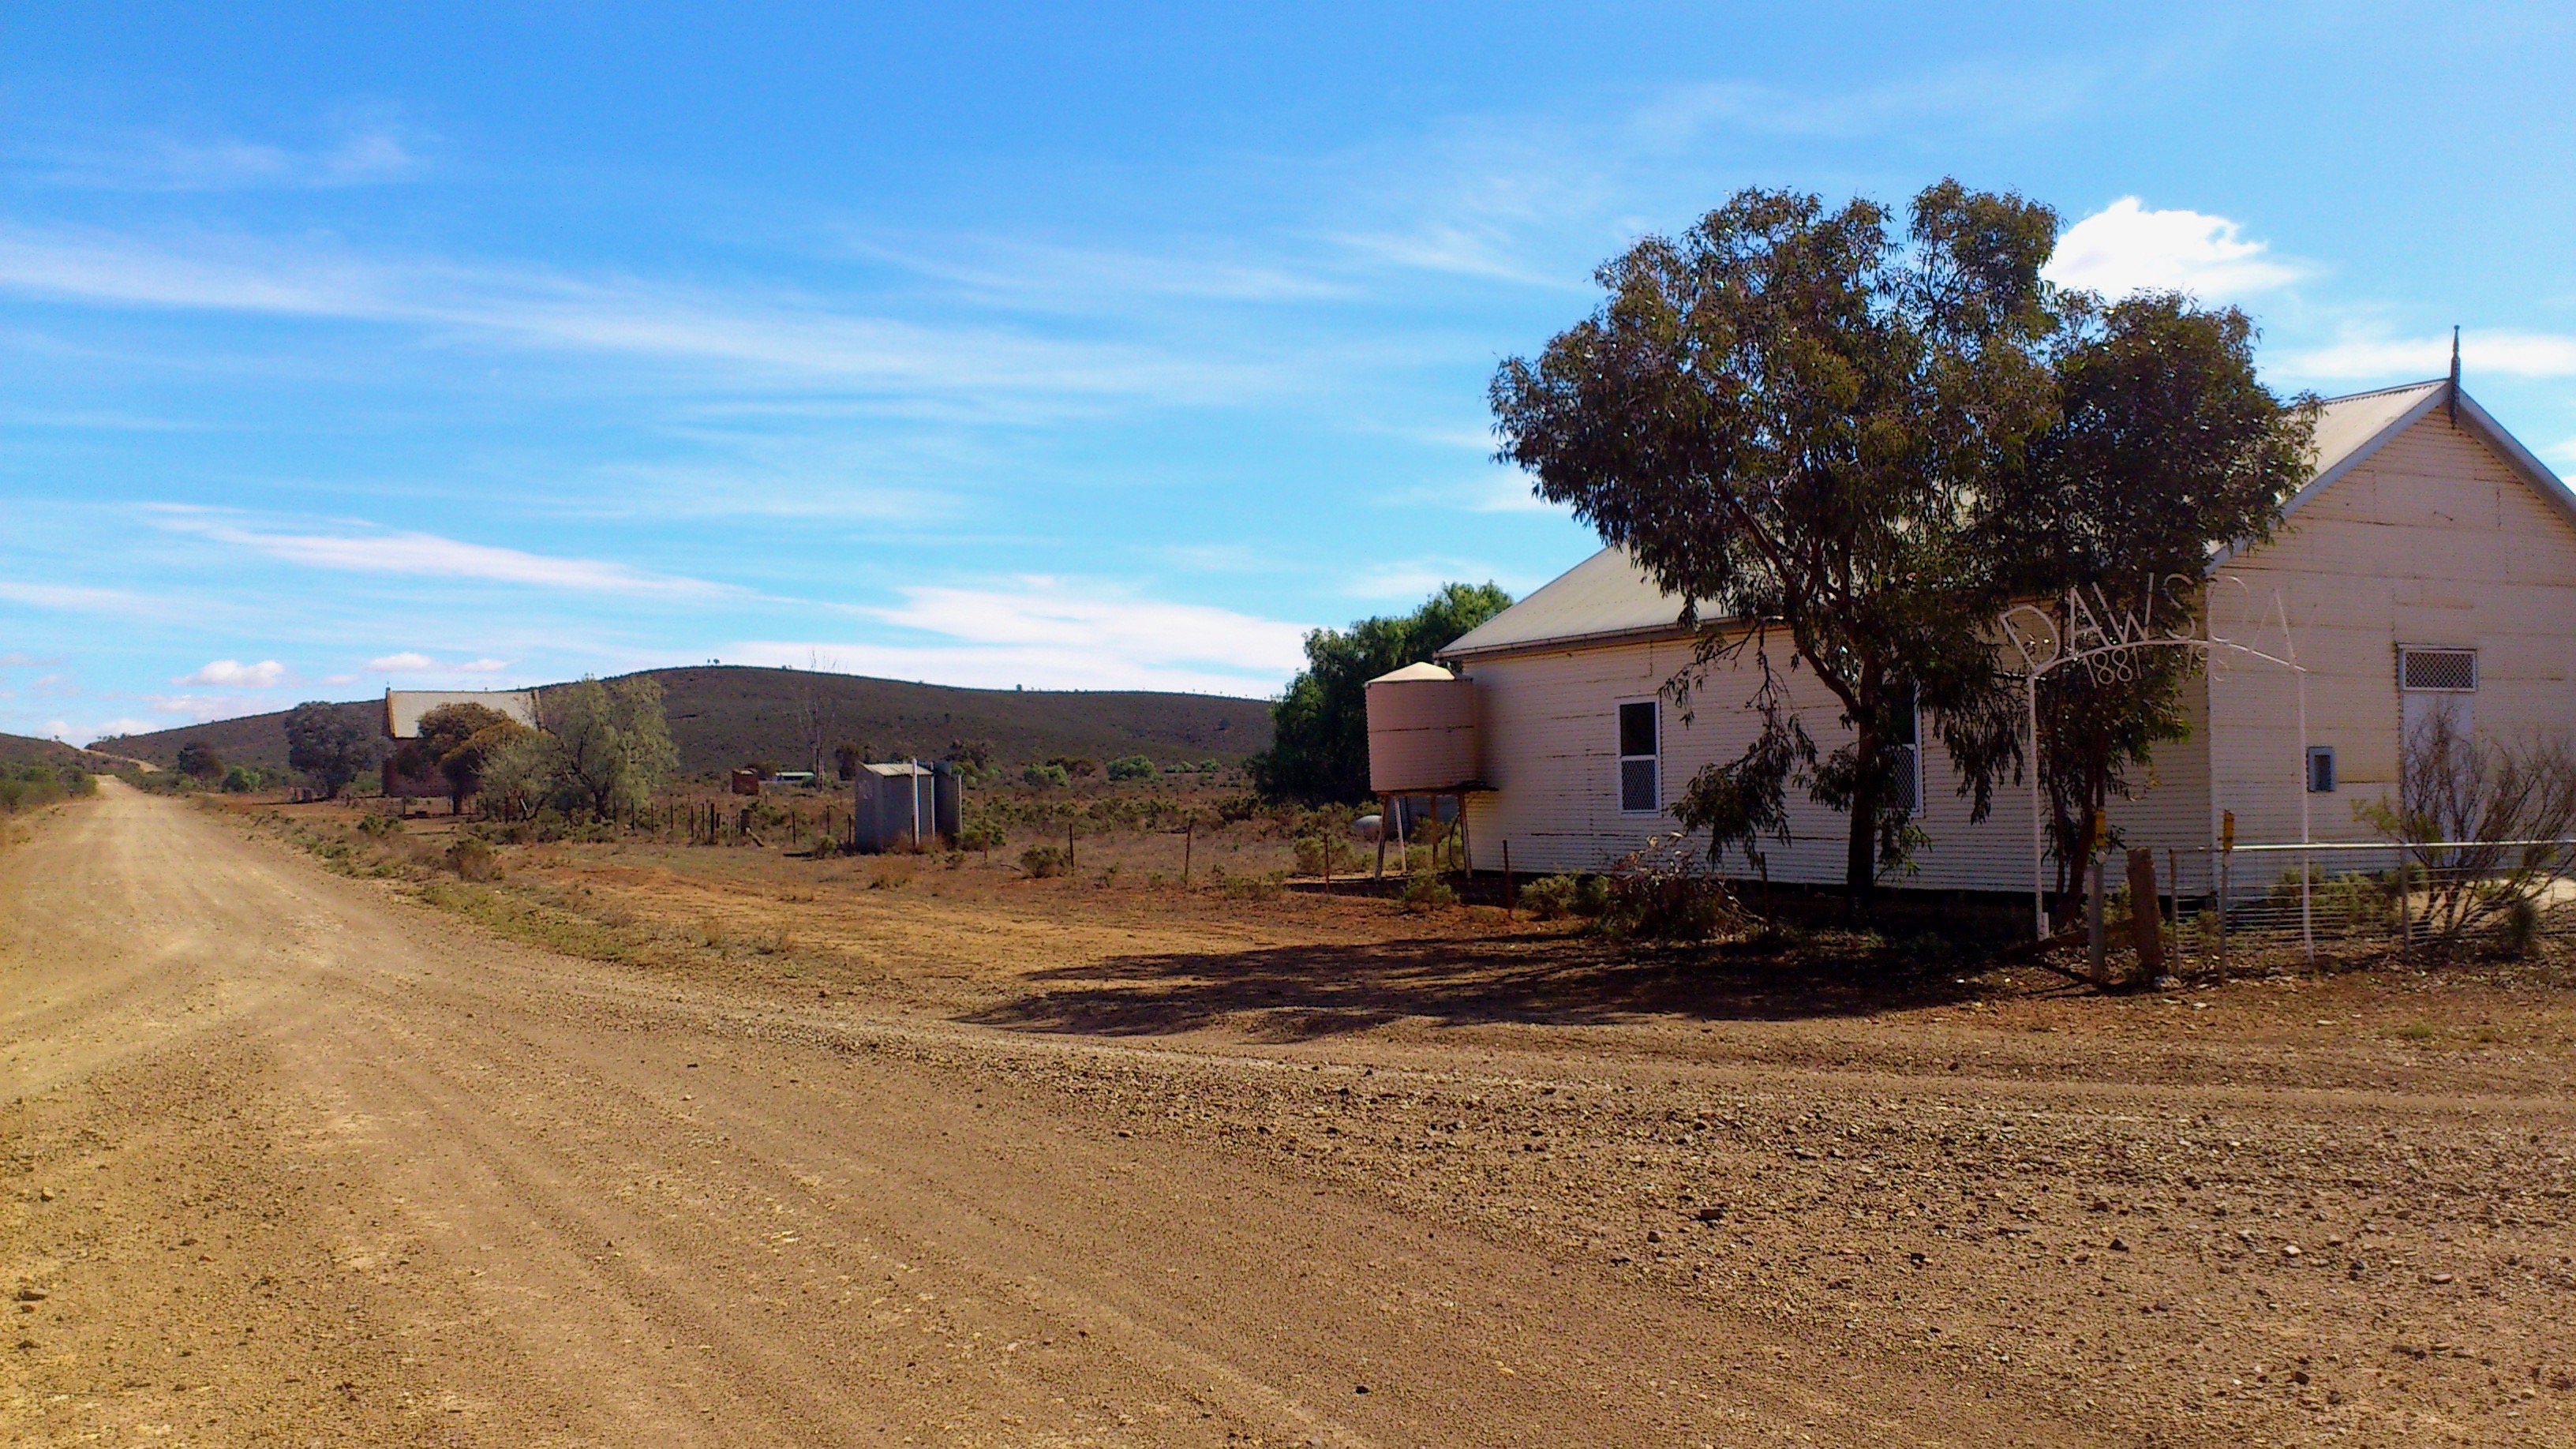
The town of Dawson (est. 1881) is located about 30km north of Peterborough. A dirt road stretches between empty grazing paddocks then winds through shallow gullies of hardened red earth, rocks and sparse vegetation. Following the road over a steep hill, the town comes into view below: a church and school on the left, whilst a ruin of the town’s hotel and an occupied residence[2] sits on the right.
[2] This residence, with its own off-grid solar power unit appeared to be the homestead of a local family. I believe that they are also the caretaker of the town, managing the schoolhouse and church.
The terrain across the township area is rust coloured, hardened and cracked. Drought tolerant vegetation propagates unevenly across the ground – scattered across empty paddocks, through dry creek beds and beneath the few trees that are around. My visit to Dawson was in late April (mid-Autumn in Australia) – a relatively mild climate. It was clearly evident that this was a region that scarcely receives any consistent rainfall year round.
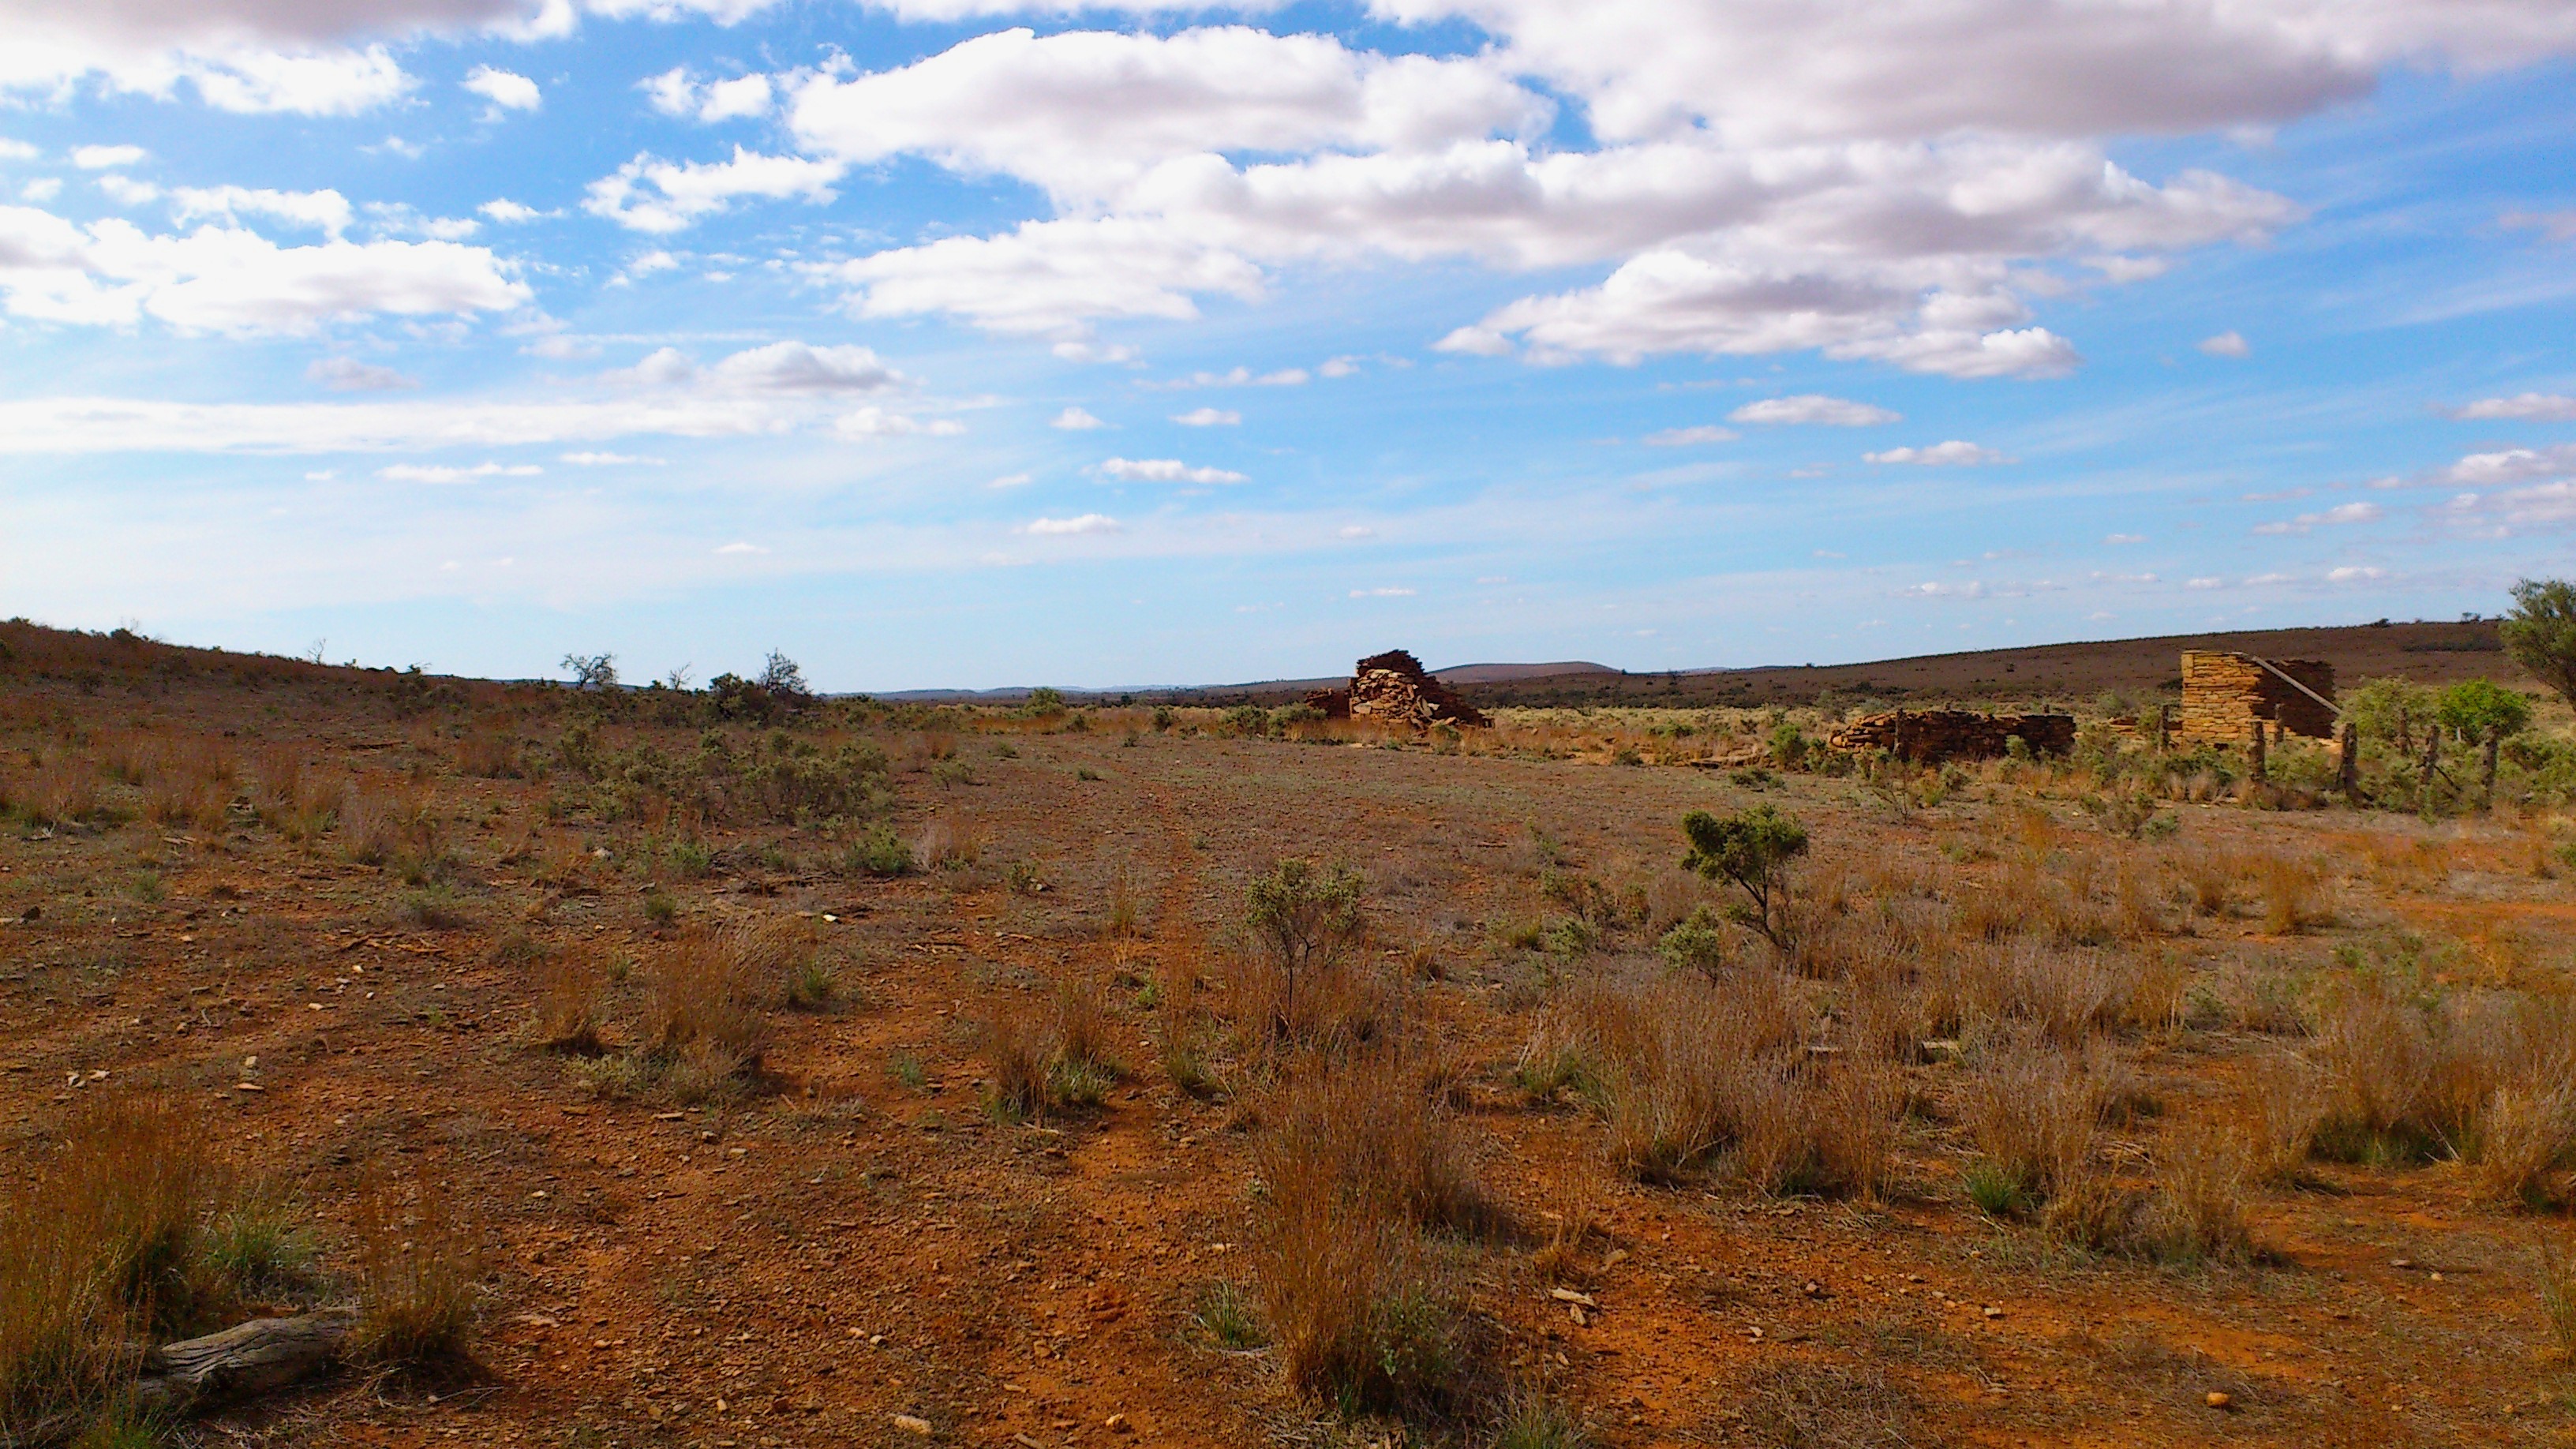
The town’s existence was essentially doomed by two factors – firstly, that of ignoring George Goyder’s advice and establishing a town north of Goyder’s Line; secondly, Dawson was originally intended to form part of a rail network, situated between the rail hub of Peterborough and Broken Hill. However the rail line was redirected to Ucolta instead, depreiving Dawson of a vital trade route for essential supplies. In spite of this, remarkably the town existed until 1981.
It was this visit to Dawson that got me interested in Goyder’s Line, what it repesented geographically, its historical importance and its relationship to the environment – both past and present. I became interested in creating a work based upon the Line and finding a way I might be able to contextualise it in a composition. Following on from my visit to the region, early in 2014 I came across a couple of published articles highlighting the remarkable accuracy of Goyder’s Line, although speculating that as a consequence of frequent drought conditions and the prevelant impact of climate change that the Line is trending southward [3].
[3] http://www.abc.net.au/news/2006-05-02/climate-change-may-shift-goyders-line/1743886?pfmredir=sm
After finding a graphical representation of the modern-day Goyder’s Line and considering this with the original Line, I now had two lines to work with which presented themselves as a graphic score of sorts. I just had to find the right application and process.
Discovering the Vocoder:
In early 2014 I was exploring the sonic possibilities of a Korg Microkorg synthesiser. One afternoon I was curious about the vocoder so I gave the manual a cursory read and started plugging in audio sources to serve as the vocoder’s carrier and modulation signals. It was when I routed two sawtooth waves of differing frequencies into the vocoder that things became very interesting. A sawtooth wave – as I reminded myself – contains all of the integer harmonics – so if you start sending sawtooth signals into a vocoder it’s going to start responding in a colourful and slightly unweilding manner.
Hang on (some of you may be asking) – 1) what on Earth is a vocoder?; 2) and how does it work? I’ll give myself about a paragraph and attempt to explain the process:
A vocoder consists of three primary elements – a carrier signal, a modulation signal and a bank of bypass filters. The modulation signal uses the filter bank to analyse the harmonic characteristics of the carrier signal and produces a modulated version of the carrier signal. So, let’s say for example that our carrier signal is my voice speaking into a microphone and the modulation signal is produced by a synthesiser tone played on a keyboard. What will happen is that the speaking voice (carrier) will be analysed by the filter bank and subsequently have the modulation signal applied to it, so that the voice will sound like a synthesiser tone, yet maintaining the semblance and characteristics of human speech.
Here’s a good example of the process (play from 2:10 mark):
So, how did my experiment sound with the sawtooth waves? Well, as most of you will probably know, a sawtooth wave has a distinct buzzing sound. When both of the sawtooth signals were sent to the vocoder a messy sonic texture resulted – far removed from the more simple, elegant process previously described of speech being modulated by a synthesiser tone. With two sawtooth waves as carrier and modulator there was a far more complex harmonic process going on and I have to admit that at this stage it didn’t sound very good at all – a bit like two dueling bansaws intimidating each other in a small room.
This experiment was ultimately redeemed when I whimsically pressed a key on the synthesiser’s keyboard. I wasn’t expecting anything to occur since I thought that the keyboard’s oscillator (as modulation signal) would be overridden by the incoming sawtooth signal routed to the modulation input. This wasn’t the case, so I now had two modulation signals – one from a sawtooth wave, the other from the synthesiser’s oscillator. This enhanced process produced a sonic result that was far more interesting – both sawtooth waves (although perceivably distinct from each other) appeared to have certain harmonics blur and smear against each other, a result of the influence of the modulation from the synthesiser affecting the sawtooth waves whilst producing also a continuous and consistent drone.
The desert appearing right before my ears:
Aspects of the sound texture reminded be of David Berhman’s On The Other Ocean (1977) and some of Eliane Radigue’s drone works (1980’s Tryptch). These are elegant works where tonalities and sound textures drift and evolve subtly over long durations. Berhman’s work in particular has this knack of evoking spaces and landscapes in a beautiful way. Though my experiment had a long way to go, already it appeared to be recalling the desert environment in and around the town of Dawson – evoking its enveloping stillness and openess with the space and depth to observe discrete changes: subtle breezes, the shadow from clouds drifting across the landscape, slight change in temperature and minute movements of surrounding vegetation and objects (leaves, weeds, fence wires, the rattle of tin roofs, etc). I was on the right track.
First version and performance of Goyders Line (July 2014):
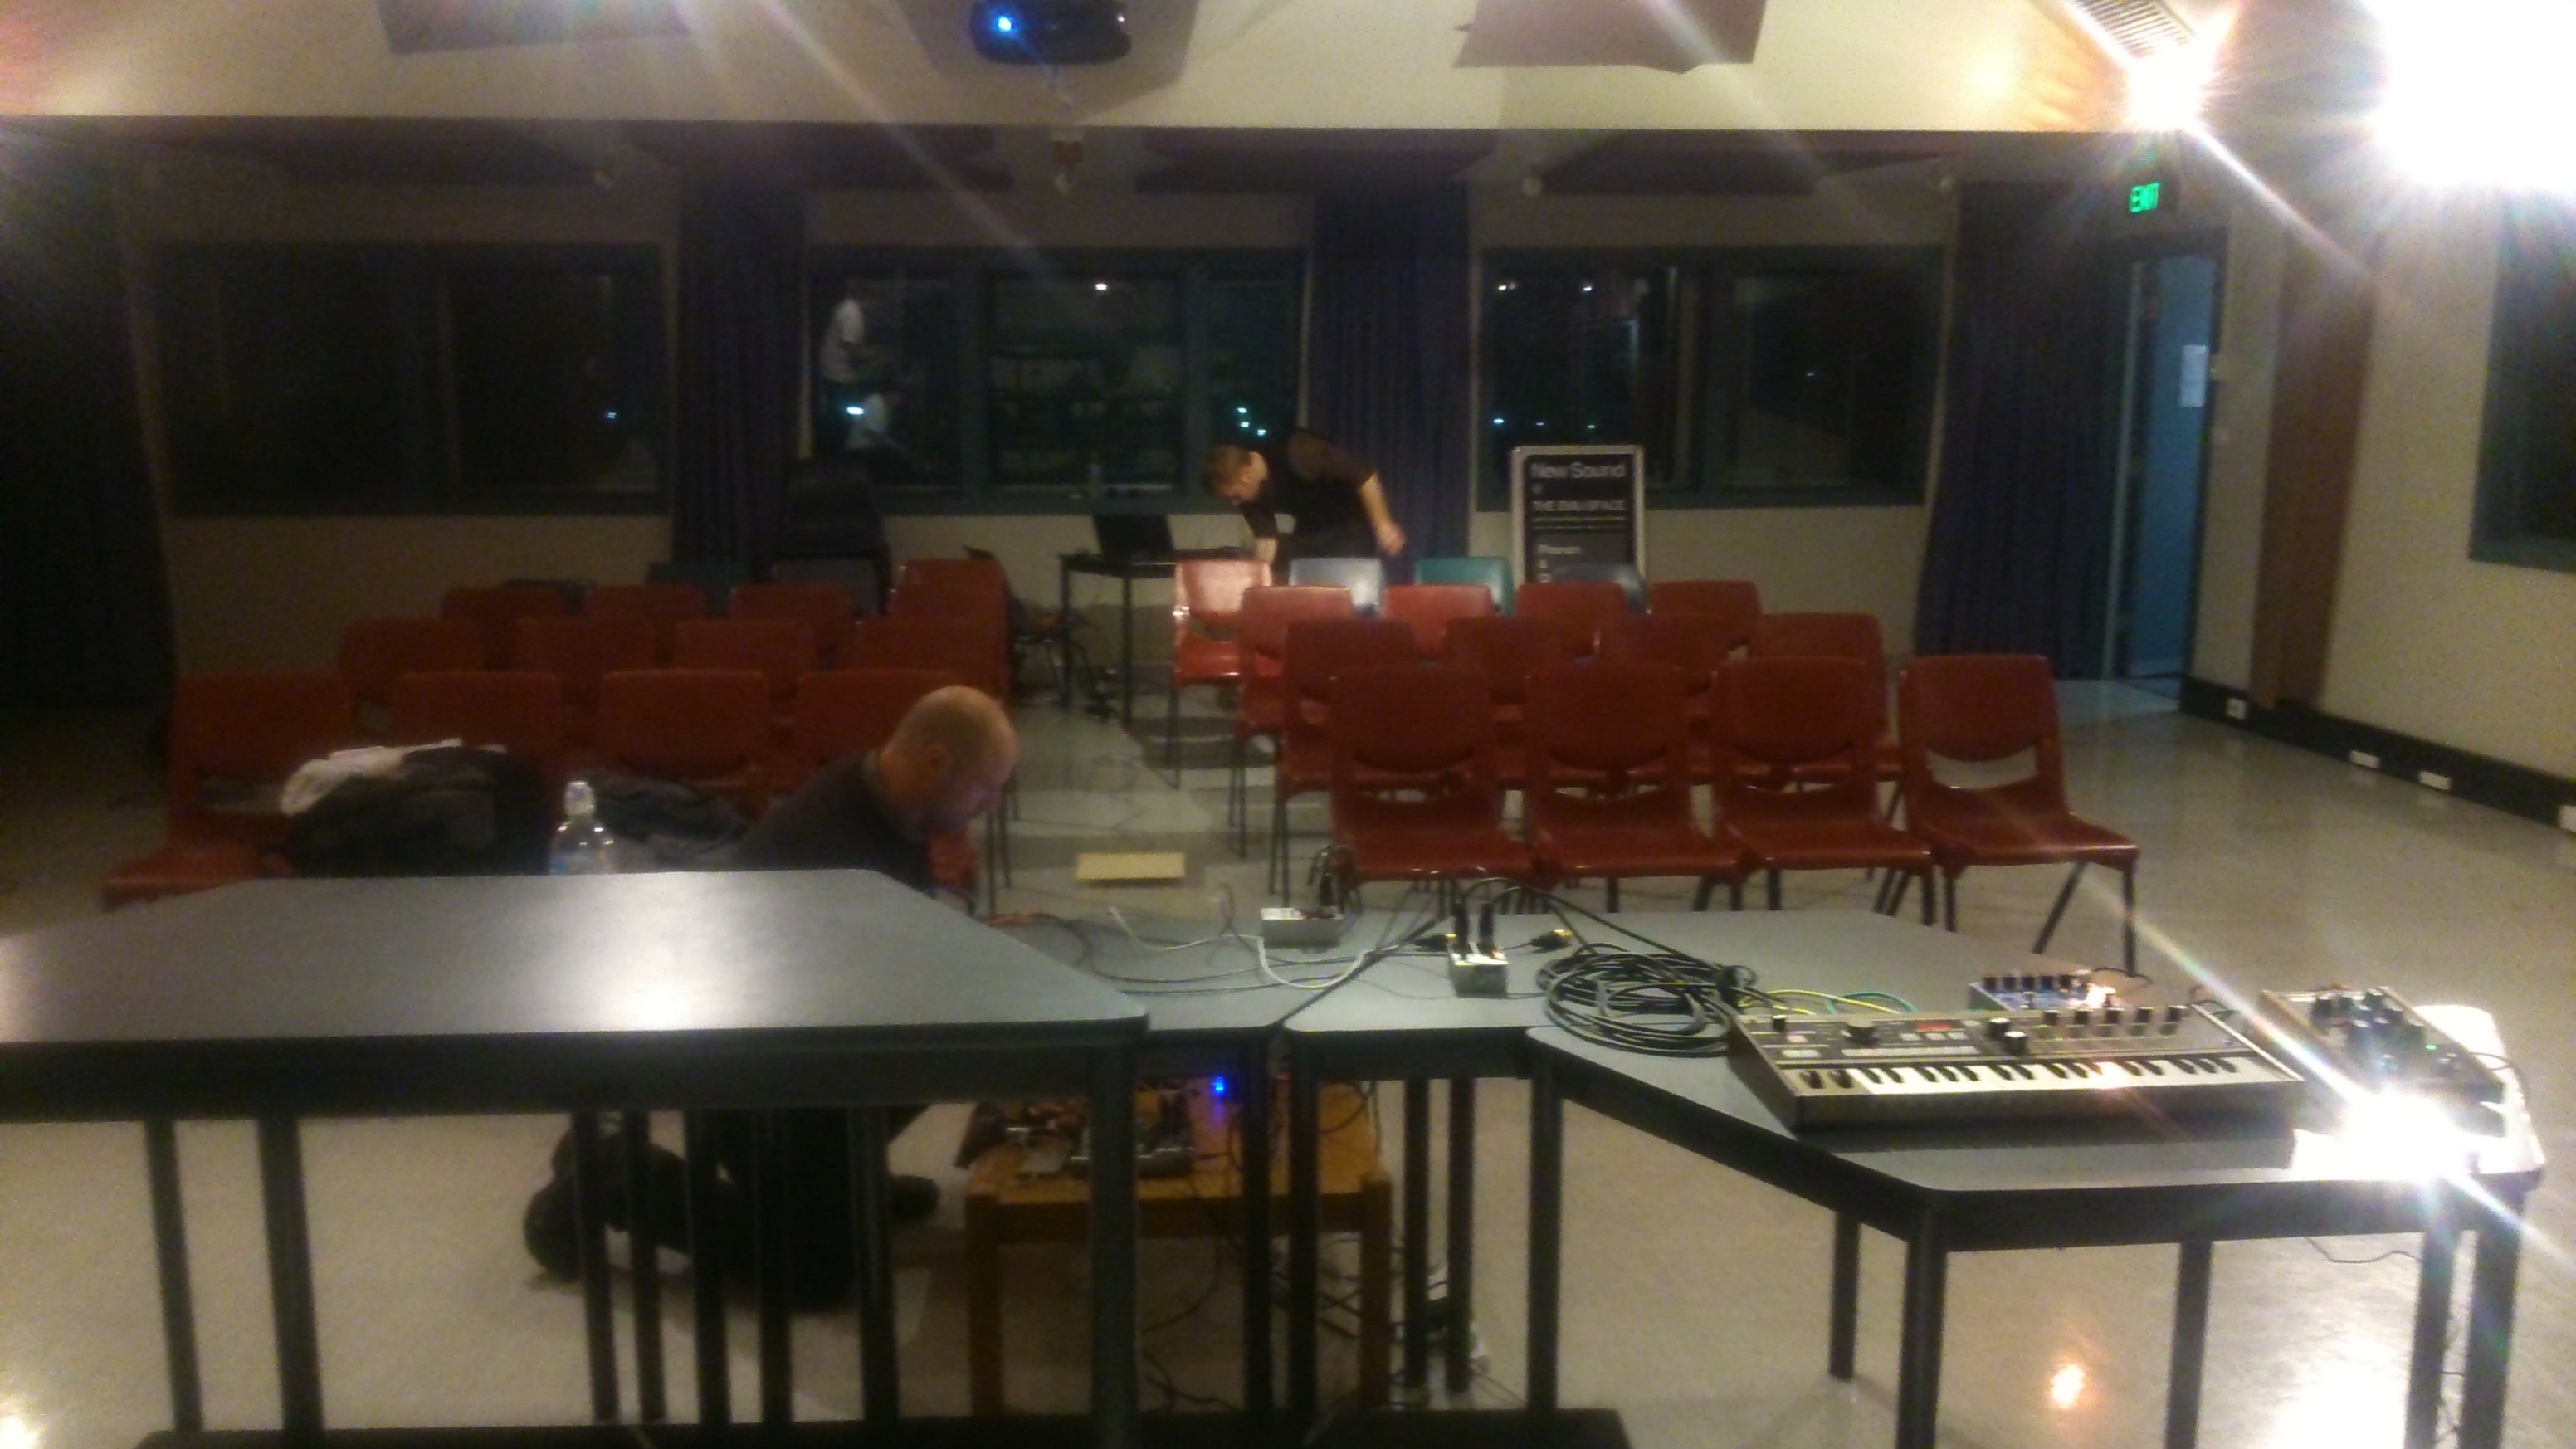
The 2014 winter in Adelaide was an absolute shocker – an arctic barrage of freezing winds, constant drizzle and to heighten the experience further, I ended up with pnumonia for a couple of weeks. When I wasn’t convalesced in bed I crawled into my studio space to rehearse a primitive version of Goyder’s Line as a support act for an upcoming concert by artists Simon Whetham and Tarab.
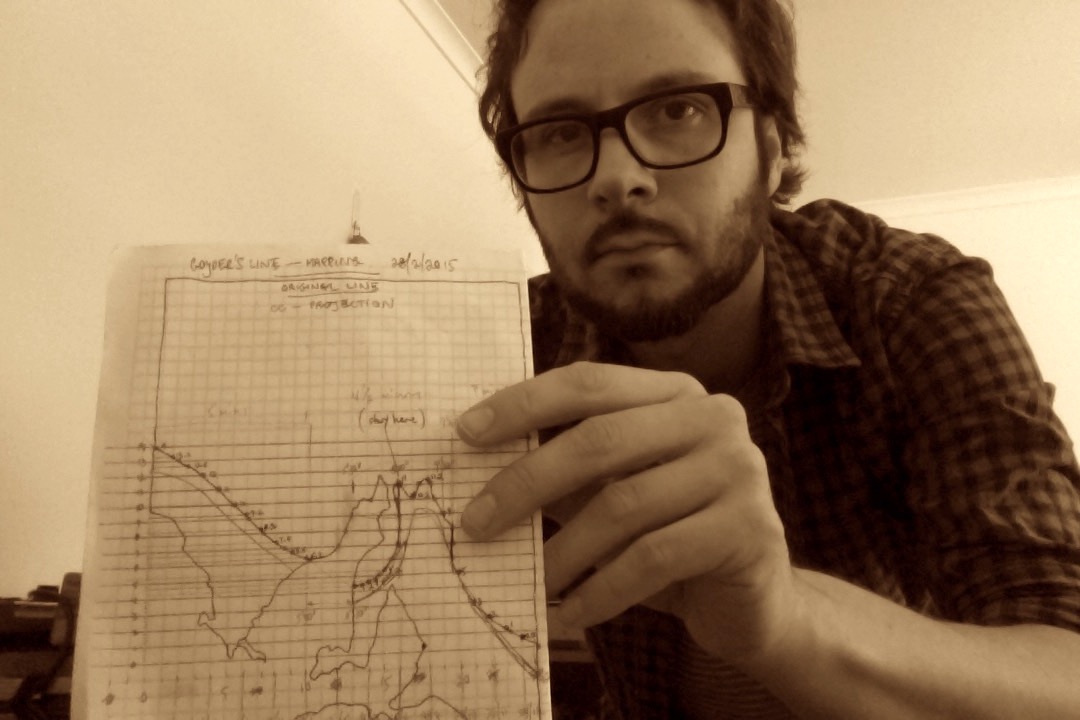
I no longer have my original notes for this performance, but I believe I had drafted a diagram on graph paper plotting the the two lines over a traced map of South Australia.
I must admit that the sawtooth waves’ respective trajectories were approximations of both Goyder Lines since I didn’t have the appropriate means to map the lines at this point to frequency over a duration of 15 minutes. Goodness, bearing in mind I had pnumonia as well. I recall simply tweaking the frequency knob of an oscillator for each of the ISOs and reading each of the lines in real time. A bit like feeling around a room in the dark. It’s certainly not accurate, more of a poetic interpretation of the Lines, but it worked in its own way at this early stage.
Although sending the sawtooth waves directly into the vocoder produced an interesting result, by this stage I decided to use some extended effects processors as a means of further affecting and warping the harmonic relationship between the two waveforms before they reached the vocoder.
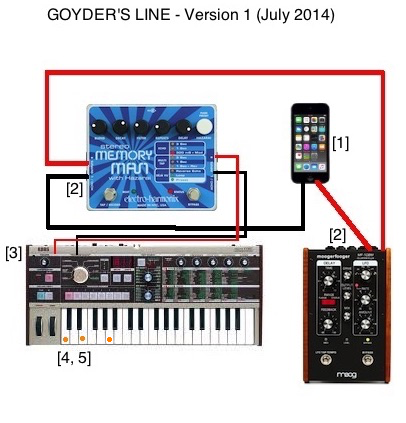
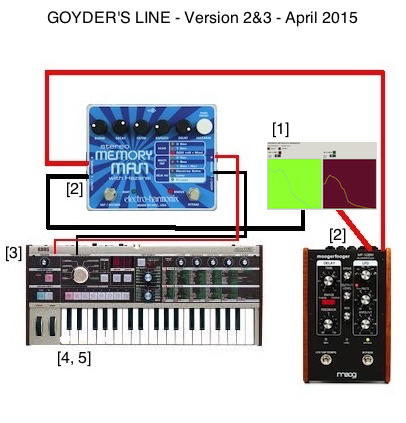
The technical process of Goyder’s Line Version 1 went as follows:
- Two pre-recorded sawtooth waves of different frequencies are played back from an iPod simultaneously, their repsecitve frequencies gradually descending until they reach zero Hz. The upper frequency (which we’ll call ISO1) is mixed to the left channel, whilst the lower frequency (ISO2) is mixed to the right channel.
- ISO1’s signal is sent to the left input of an Electroharmonix Memory Man (EHX-MM) – which is a stereo delay pedal with additional reverb effects. ISO2 is routed to the Memory Man, but before it reaches the right input of the EHX-MM it is sent via a Moog MF-108M (MF-108M), which is a fancy flanger.
- The left and right output of the EHX-MM are then routed to the vocoder inputs of Microkorg – ISO 1 is routed to the Carrier input of the vocoder and ISO2 is routed to the Modulation input of the vocoder.
- A customised setting on the Microkorg is selected, which allows a chosen interval (C-E-A) to be sustained over the duration of the performance.
- At the beginning of the performance, the sawtooth waves are played back from the iPod, with ISO 1 and 2’s signals subject to discrete modulations before reaching the Microkorg’s vocoder.
- The performance concludes one both of the sawtooth waves have reached zero Hz.
Here’s a couple of brief snippets from the performance that night. Captured by Sebastian Tomczak:
Andrew Lord, who was present at the performance offered the following observations on this early version of the work:
This was gentle, still music with a throbbing texture that ebbed and flowed, slowly developing and changing. It seemed to be music more about textures than about events, but Louth-Robins seemed to pull off something of a magic trick – you realized at the end that it had become something completely different from what it was at the start and it happened under your nose and you didn’t know how. The throbbing pulses that were playing off each other gradually disappeared and left purer extended tones before the piece ended. [4]
[4] https://tristanlouthrobins.wordpress.com/2014/08/07/new-sounds-at-emu-18-review-by-andrew-lord/ NOTE: Andrew’s website (aplord.com) appears to be not active as of February 2017. This is a link to a republication of the review on my blog.
Second and Third versions: Max/MSP comes into the mix (early 2015)
Following the performance in July 2014, Goyder’s Line was put on ice for the remainder of the year as other projects and activities took priority. By the time I returned to the work in 2015 I was eager to refine the Lines and render them a little more accurately and faithfully. Max/MSP seemed like the most ideal way to realise this.
Max/MSP is patching paradigm software which I’ve used on an infrequent basis since 2002. It can be used and applied in number of ways. Although it is predominantly music and sound based, more recent iterations of the software (Vizzie, Jitter) have provided the ability to design and control aspects of visual media.
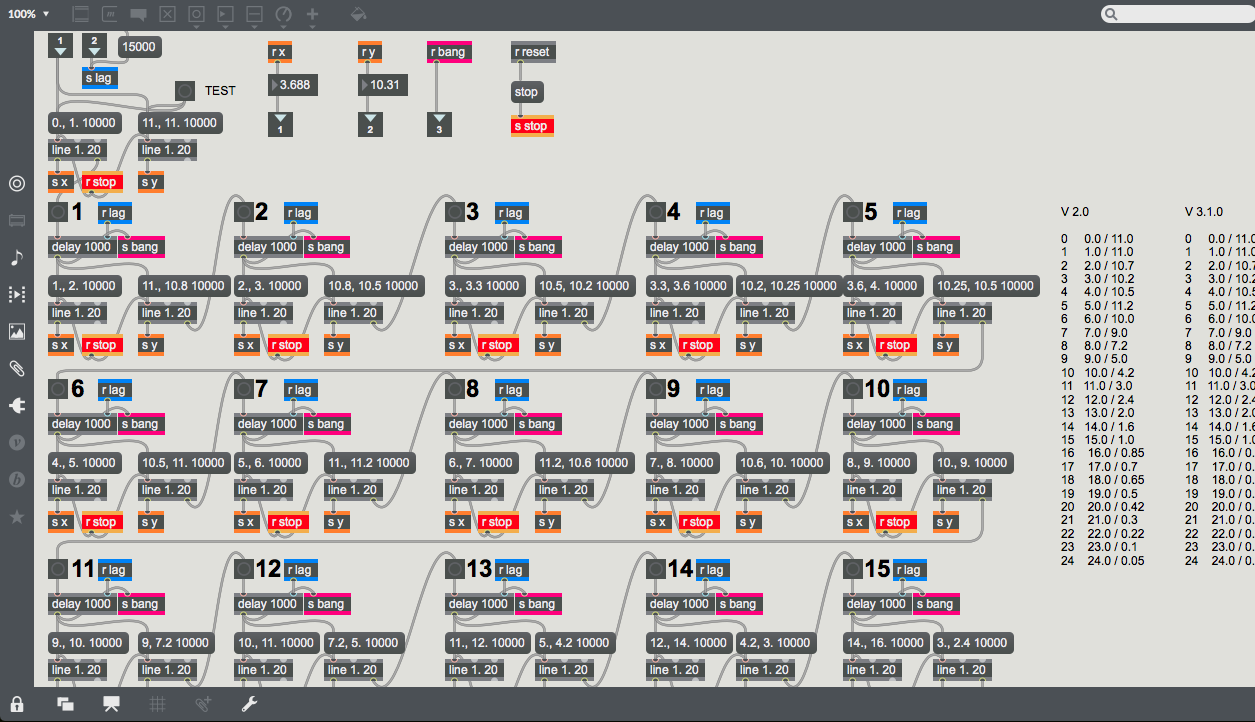
I employed Max/MSP for two reasons: to be able program the ISO line mapping and to draw the ISOs as faithful representations of both Goyder Lines. The ISOs would – like the previous version – provide the trajectories for the respective frequencies of the sawtooth waves to follow.
Looking back now, with Max/MSP I easily achieved one of these goals (presets) whilst the other (drawing the line) was an arduous process of complex sub-patches, refinement, losing my patience…and further refinement. The line drawing function was particularly laboureous insofar that I can’t believe I subjected myself (or the software for that matter) to such a painful process.
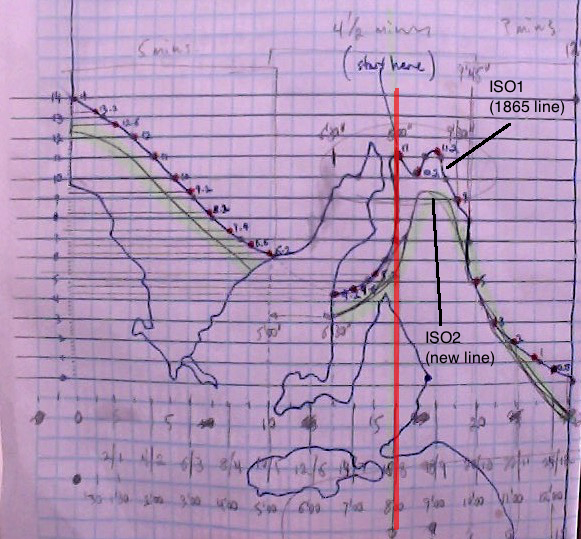
The mapping of the lines to frequencies was derived from the above sketch, whereby the points on the x axis (marked 0-14) would represent a multiple of a frequency. So that a point at 11 would be subject to a simple equation (x axis point * 100 / 3.5 = frequency) so that a point at 11 would equal 314.28 Hz.
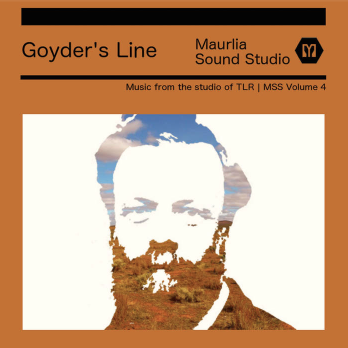
With the extended effects (EXH-MM and MF-108M) still in place, I made several recordings of this set-up in mid-2015, with Version 3 of Goyder’s Line released as part of my self-released Maurilia Sound Studio series.
Each of the three variations on the release are identical in duration (12 minutes) but vary significantly in terms of timbre and harmonic behavior due to the chord position played on the synthesiser. So Variation 1 consists of a C-E-A chord pattern, whereas the other two Variations consists of E-A-G and F-A-D. The influence of the synthesiser as modulating signal radically affects the vocoder’s behavior, resulting in three unique variations of the same process.
An additional feature developed in Max/MSP patch permitted a delay (what I’ve termed as a ‘suspension’) at each of the draw points. This created a wonderful effect, whereby the intervals between the ISOs would be briefly suspended at a given point, allowing harmonic interplay and modulations to develop before the next stage of the line is drawn.
For example:
- 1) Start point at coordinates x axis 1.0, y axis 11.0.
- 2) Draw line to coordinates x axis 2.0, y axis 10.8, taking 1000 milliseconds (10 seconds) to perform this process.
- 3) Once reached x 2.0, y 10.8 pause (suspend) next line draw for 10000 milliseconds (10 seconds)
- 4) commence next line draw.
You can listen to these three variations below:
Fourth version (late 2016 to early-ish 2017):
Although the third version of Goyder’s Line was regarded as a genuine release in July 2016, it still very much represented a work in progress.
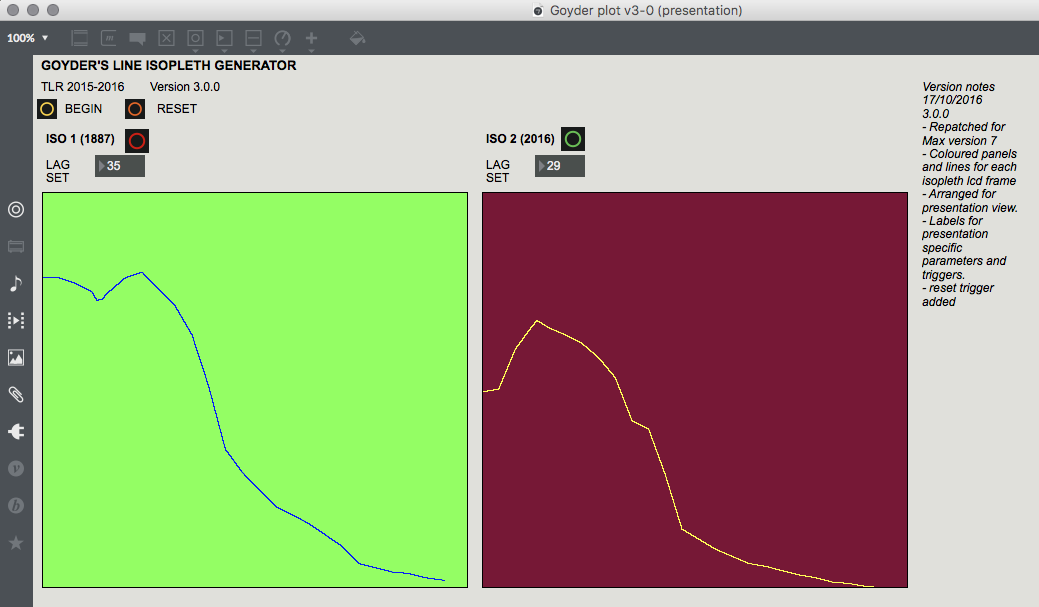
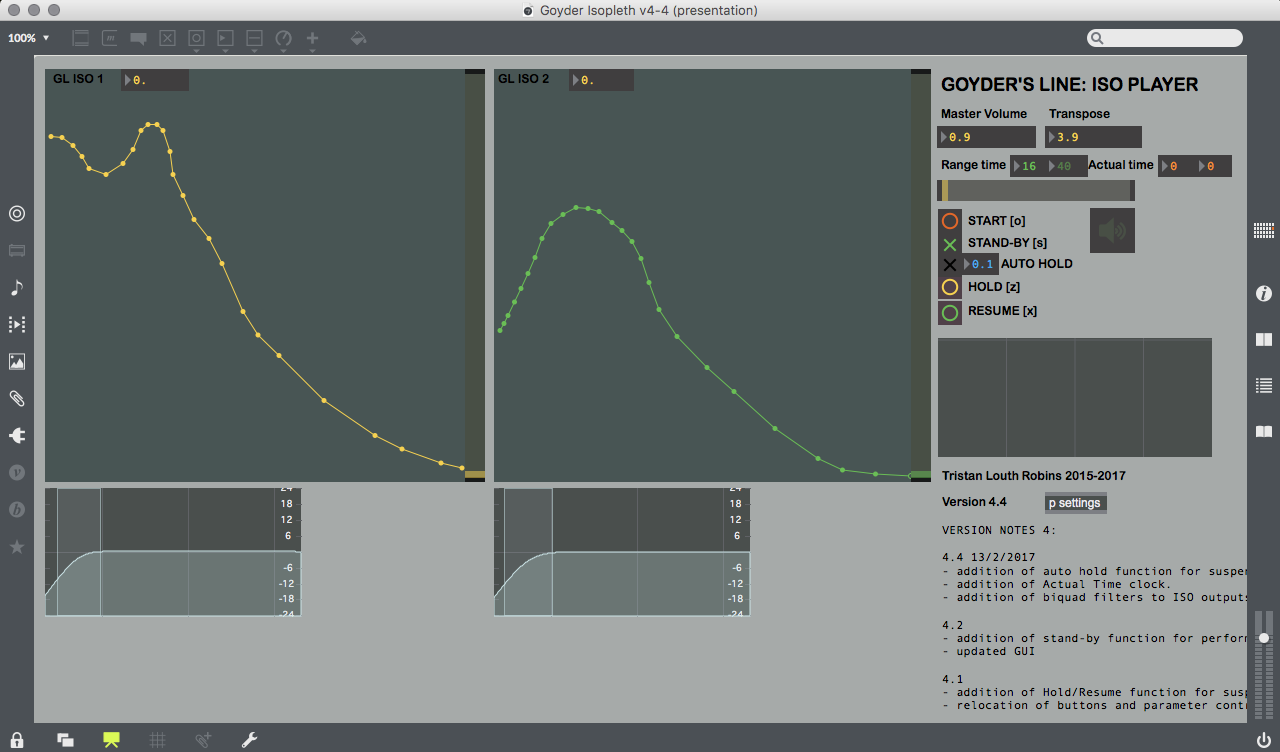
In the development of Goyder’s Line version 4 significant refinements were made in Max/MSP to the rendering of the ISO lines whilst the patch design now included an array of features which allowed the control of various parameters. As you can see in the above image, it’s a lot more easy on the eyes.
The ISO lines were now plotted using a ‘function’ table which allowed points of the respective lines to be plotted and dragged into place, allowing the composition of lines with more accurate degrees of elevation, descent, trajectory and contour.
The features in Version 4 include the following:
- A duration function – allows the duration of the line draw to be defined (can be a short and bumpy 30 seconds to an epic 48 minutes)
- A transpose function – this feature allows the frequency range of the ISOs to be adjusted.
- A stand-by function – allows the piece to begin as a ‘suspension’ at the ISOs starting point and commence upon deactivating the stand-by.
- A auto-hold function – this feature sets the frequency of ‘suspensions’ during the line draw. Can currently be set between 2-20 seconds or can be deactivated altogether.
- Manual hold/resume function – this can be used in place of the ‘auto-hold’, whereby suspensions can be manually performed.
- An ‘actual time’ counter – this was incorporated to accomodate the duration setting and hold functions, since performing ‘suspensions’ throughout the work will inevitably make the duration longer than the defined duration prior to performance.
- A spectrograph to visualise the interplay between the two ISOs throughout performance.
- A low pass filter for the ISOs to attenuate frequency response below 50Hz.
Below is a video clip featuring the latest recording of Goyder’s Line. However, it has been abbriviated to 15 minutes since that’s the maximum length permitted on YouTube:
Where to now?
With this latest version performing beautifully in the studio, it feels as though the design of the system that drives Goyder’s Line is finally complete and is doing what I intended it to do. However work still needs to be done exploring the thematic and contextual aspects of the work.
Currently I’m working on a more academic-styled paper for the upcoming Australasian Computer Music Conference which is being hosted here in Adelaide during September 2017. There’s also a plan to perform the work at ACMC. This should provide an excellent and exciting platform to present and discuss the work further.
***
So that’s it for now. Hopefully this epic blog post (by my standards) has been reasonably informative and understandable.
Thanks for reading.
Peas and larvae,
TLR


Leave a comment